Let’s be real:
For many of us, coffee is a lifeline. For others, it’s about savoring every sip. Either way, we’re drinking a lot of it.
It got me thinking: How much are we actually spending on it?
We at Coffee Holli were curious too. We surveyed 479 people to delve into the financial side of our coffee habits.
Is your coffee budget on par with the average American? Let’s dive in and find out.
Table of Contents
Key Takeaways From this Survey
This research uncovers compelling insights about Americans’ coffee consumption patterns, preferences, and spending. Here are the most significant findings:
- 32.8% of respondents spend between $21 to $40 on coffee monthly, making it a common spending bracket.
- K-cups, pods, or instant coffee are the preferred choice for home brewing, with over half (50.3%) of the participants opting for it.
- Regardless of their brewing location, a significant 58.7% primarily spend on K-Cups, pods, or instant coffee.
- Factors influencing coffee purchases are led by quality at 69.5%, followed by price at 64.7%, and convenience at 44.1%.
- The data highlights that more American women spend on coffee than their male counterparts.
- Delving into age demographics, 26.3% of the coffee spenders are aged 55 to 64 years old.
- 24% of Americans who indulge in coffee have a monthly income ranging from $1001 to $2000, while 25% spending over $100 on coffee boast an income above $5000.
- Regionally, New York is noteworthy, with 6.9% of its populace investing in coffee monthly. Yet, it’s California where 20% of coffee enthusiasts spend a lavish $100 or more on their caffeine fix.
This survey paints a comprehensive picture of coffee consumption in America, backed by data from varied demographic segments.
Over 75% of Americans Spend $60 or Less for Coffee Each Month
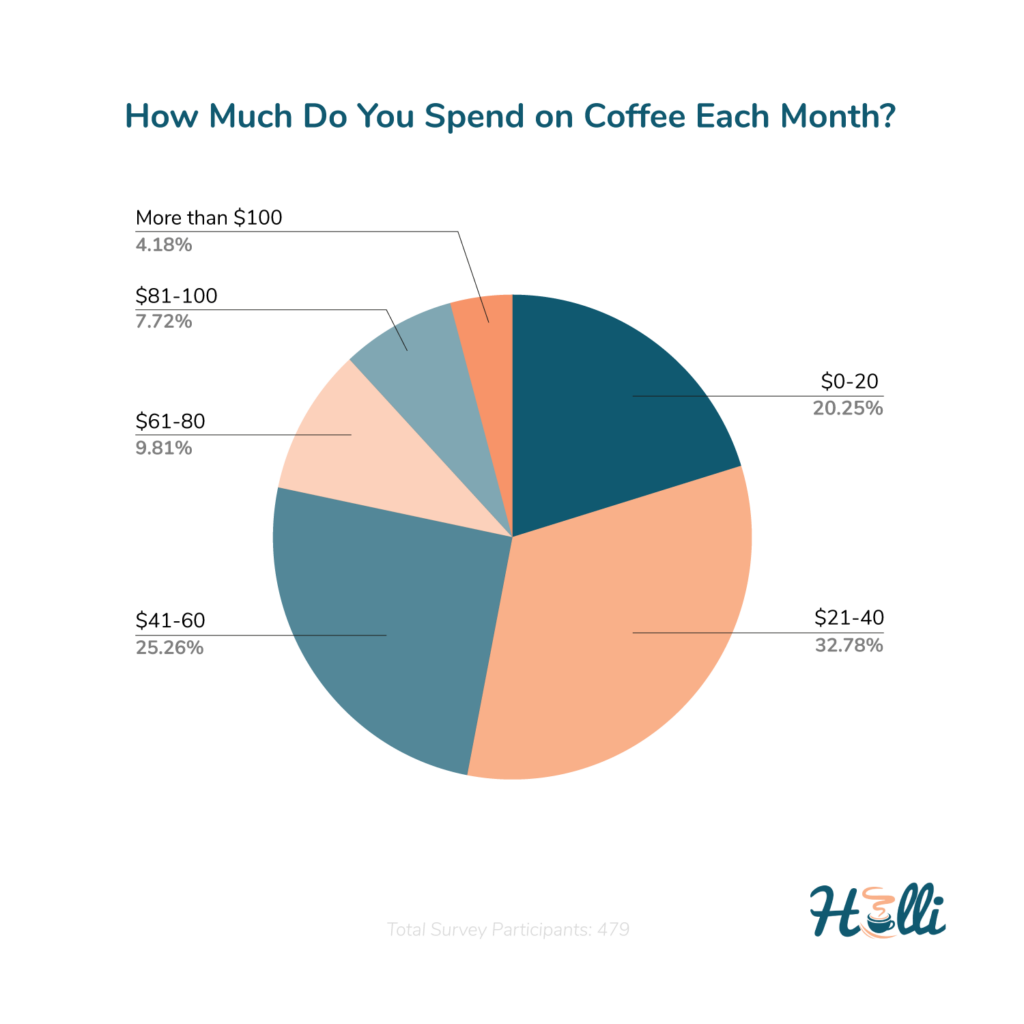
Our comprehensive survey delved into the monthly coffee spending habits of Americans, capturing data from a diverse demographic. The findings show a dominant spending bracket that stands out amidst all participants, with three main categories collectively representing a significant 78.3% of all respondents.
Monthly Coffee Spending in the US:
- $21 to $40: 32.8%
- $41 to $60: 25.3%
- $0 to $20: 20.3%
Together, these figures indicate that the majority of Americans (nearly 78.3%) spend $60 or less on coffee each month.
On the flip side, there are also those who invest a bit more in their monthly caffeine fix:
- $61 to $80: 9.8%
- $81 to $100: 7.7%
- Over $100: 4.2%
This data not only emphasizes the popularity of the $21 to $60 spending range but also points to considerable variations in both the lower and upper spending brackets.
To further contextualize these findings, a Reddit poll from the previous year offers an insightful comparison. Excluding participants with zero coffee expenditure, the majority reported monthly spends between $1 and $50. This further reinforces the primary data trend observed in our survey.
Home Brewing Dominates: Over 80% of Americans Choose to Make Coffee at Home
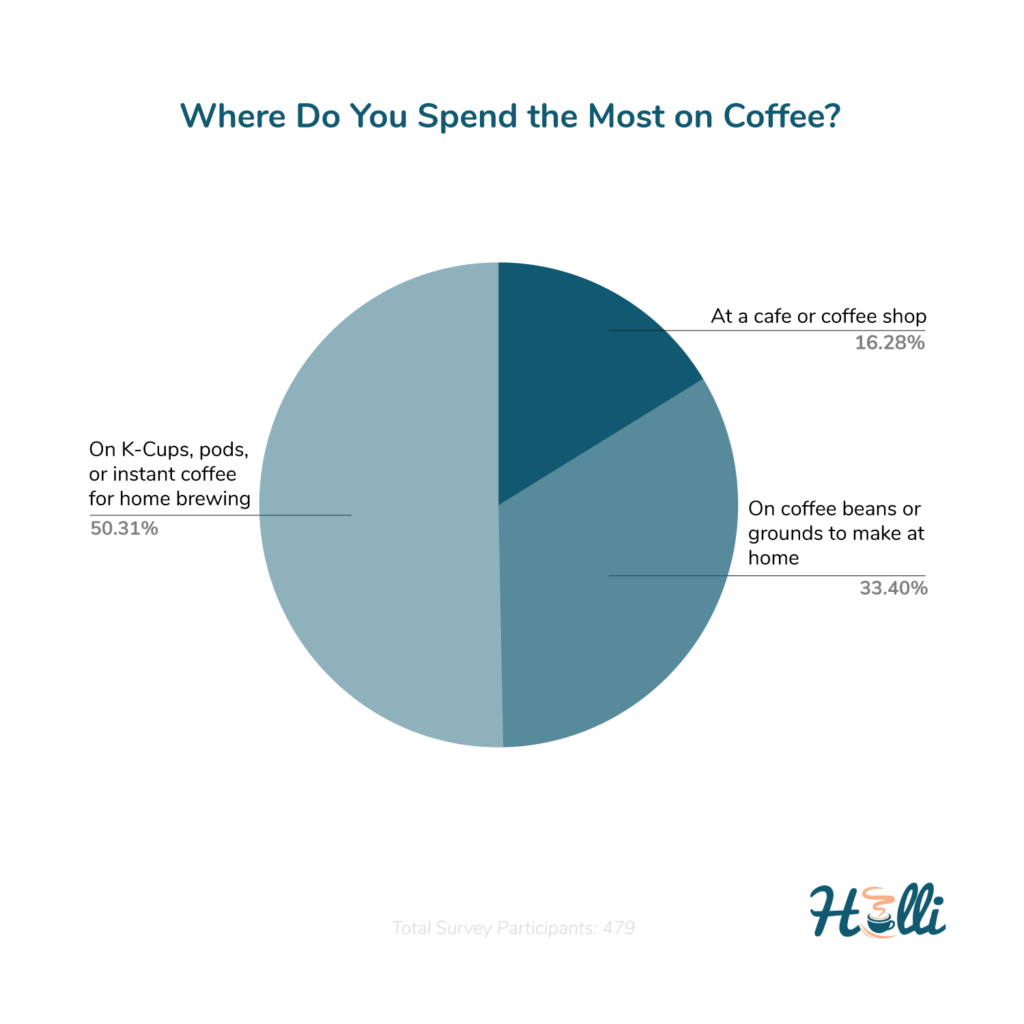
Our survey sheds light on the coffee consumption preferences of Americans, indicating a clear trend towards home-brewed coffee. Delving into the specifics:
Coffee Preferences in the US:
- K-Cups, pods, or instant coffee: 50.3%
- Brewed from coffee beans: 33.4%
- Purchased from cafes or coffee shops: 16.3%
Drawing a parallel, a consumer study from Poland found that a whopping 95.5% of respondents preferred sipping coffee made at home. This might suggest a global inclination towards the comfort and freshness of home-brewed coffee.
The prevalent choice for K-Cups, pods, or instant coffee could be attributed to the working class’s penchant for a swift cup of joe to kickstart their day. These options are not just convenient but also ensure a rapid brew.
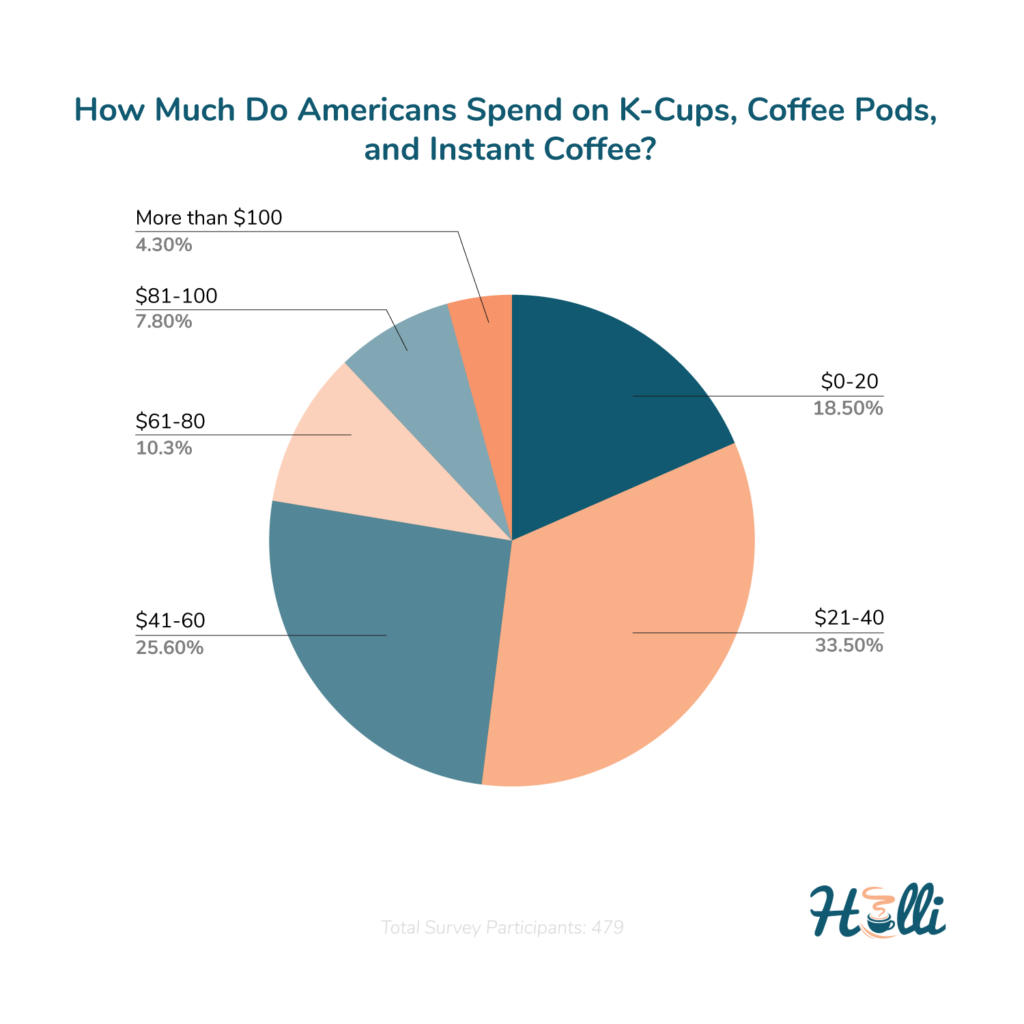
Monthly Coffee Spending Insights:
Considering the economic shifts over the past year, our updated findings reveal:
For K-Cups, pods, or instant coffee:
- 35.3% spend $21 to $40
- 25.3% allocate $41 to $60
- 17.8% budget $0 to $20
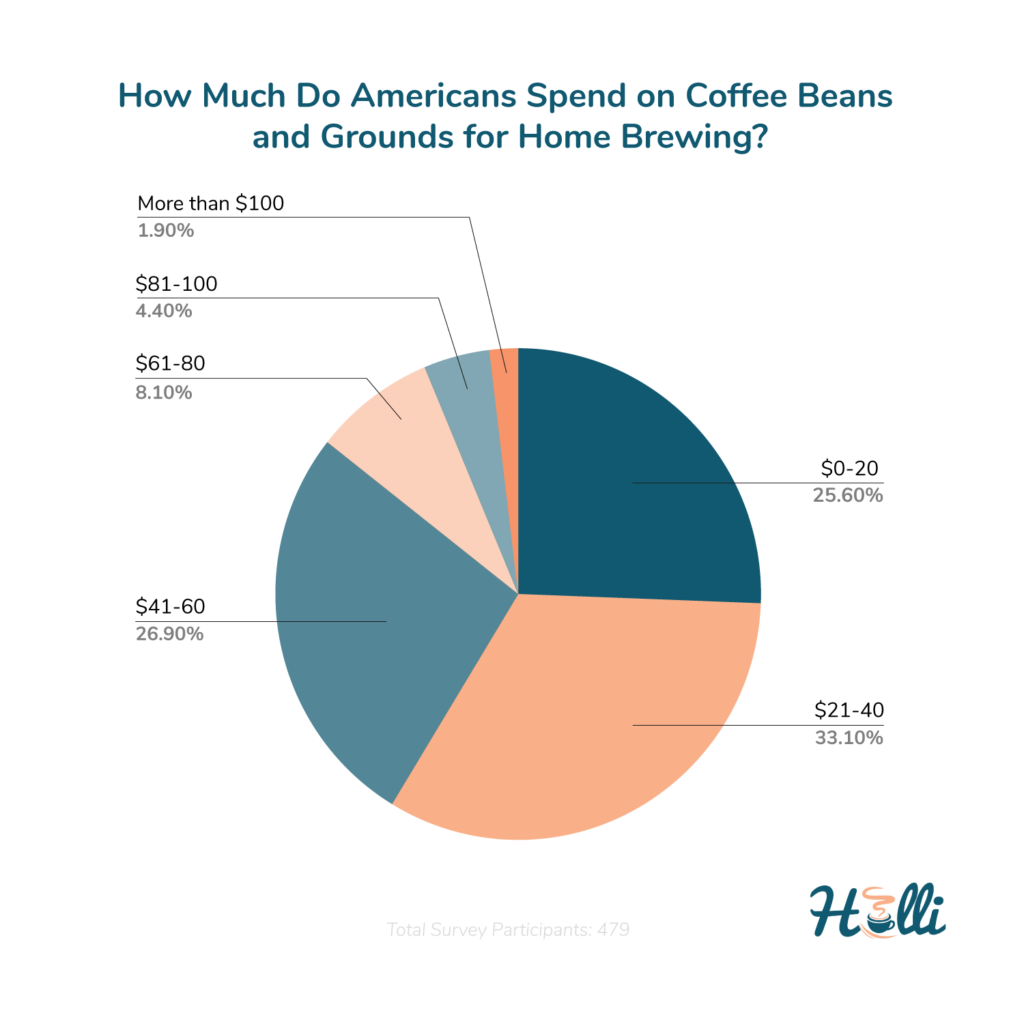
For those buying coffee beans:
- 33.1% spend $21 to $40
- 26.9% earmark $41 to $60
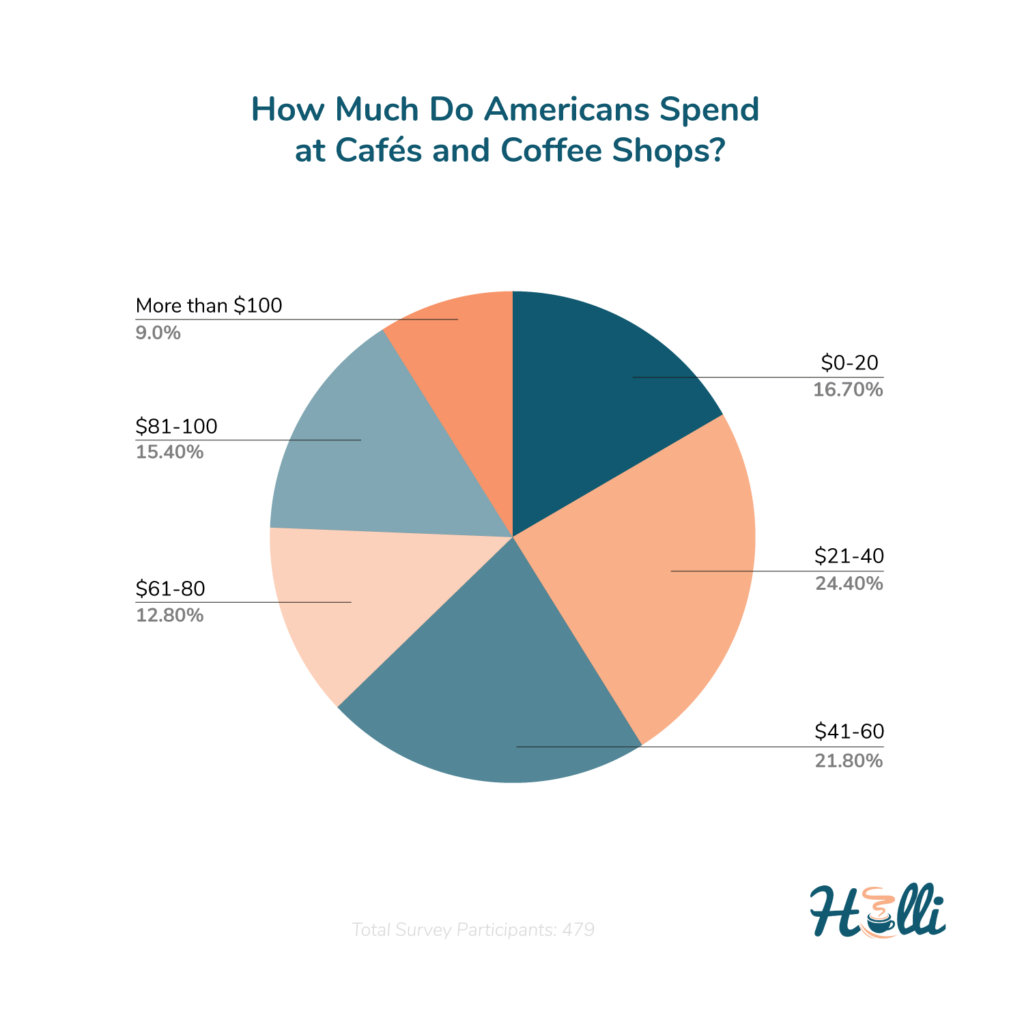
Coffee shop enthusiasts:
- 24.4% spend $21 to $40
- 21.8% spend $41 to $60
Interestingly, a mere 1.9% of respondents spend over $100 on home-brewing with coffee beans. Evidently, for the typical American, the high expenditure doesn’t seem to align with perceived value.
The data underscores that the majority find solace in the cost-effectiveness and convenience of K-Cups, pods, and instant coffee at home, making it a pragmatic choice for many.
K-Cups, Pods, or Instant Coffee? 60% of Americans Vote for Convenience
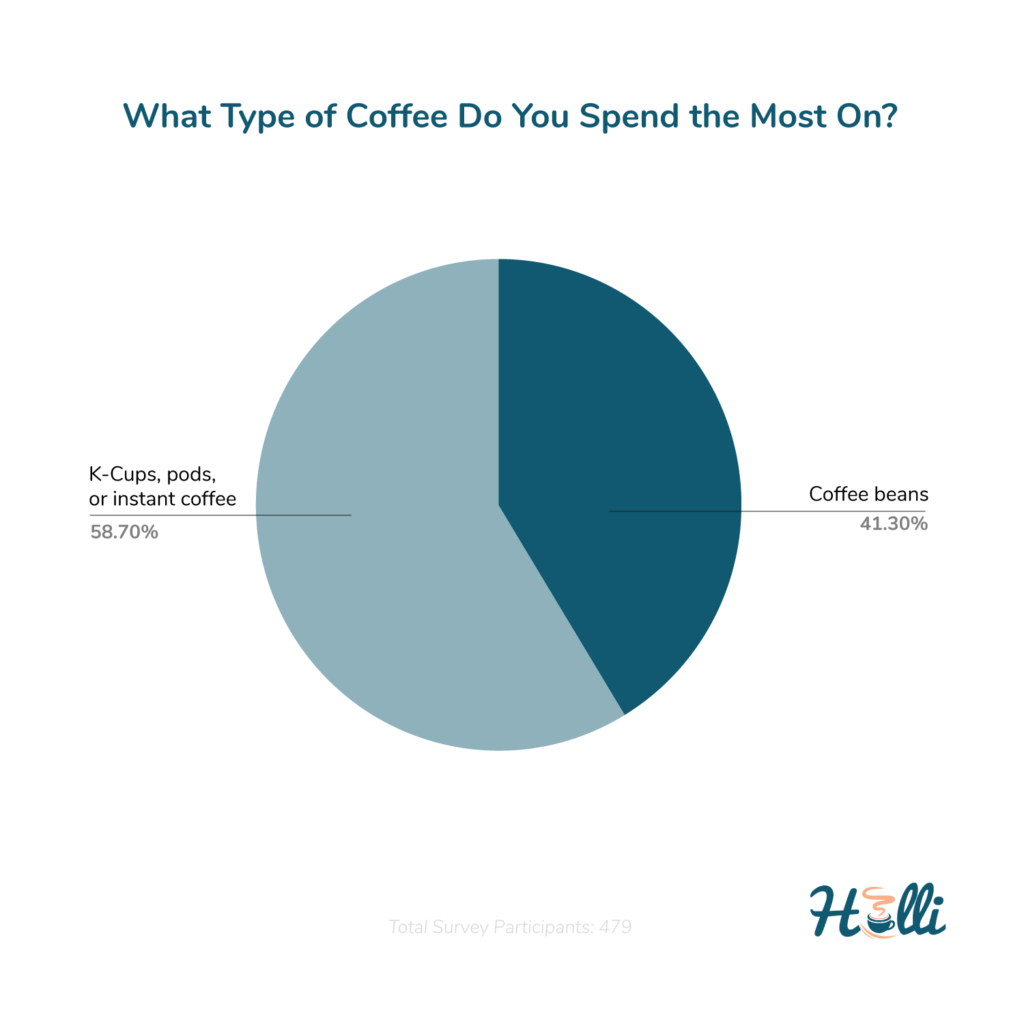
Given the two choices—fresh coffee beans or the easy-to-prepare K-Cups, pods, or instant coffee—where do you think the majority leans? Our data provides clarity on this:
Coffee Purchase Preferences in the US:
- K-Cups, pods, or instant coffee: 58.7%
- Coffee beans: 41.3%
This distinct preference warrants the question—why the pronounced favor for one over the other?
Sarah Rose, a distinguished researcher in the world of coffee, offers his perspective: “K-Cups offer unparalleled convenience and are often more readily available than coffee beans. However, those who opt for coffee beans undoubtedly prioritize the rich, authentic taste that comes with it.”
Breaking Down the Monthly Spending:
For those preferring the convenience of K-Cups, pods, or instant coffee:
- 33.5% spend $21 to $40
- 25.6% allocate $41 to $60
In the coffee beans camp:
- 31.8% earmark $21 to $40
- 24.7% spend $41 to $60
This data underscores the balance between ease and flavor that Americans weigh when choosing their coffee. Whether it’s the quick fix of a pod or the aromatic allure of freshly ground beans, personal preferences shine through.
Quality, Price, or Convenience? Over 90% of Americans Prioritize These When Purchasing Coffee
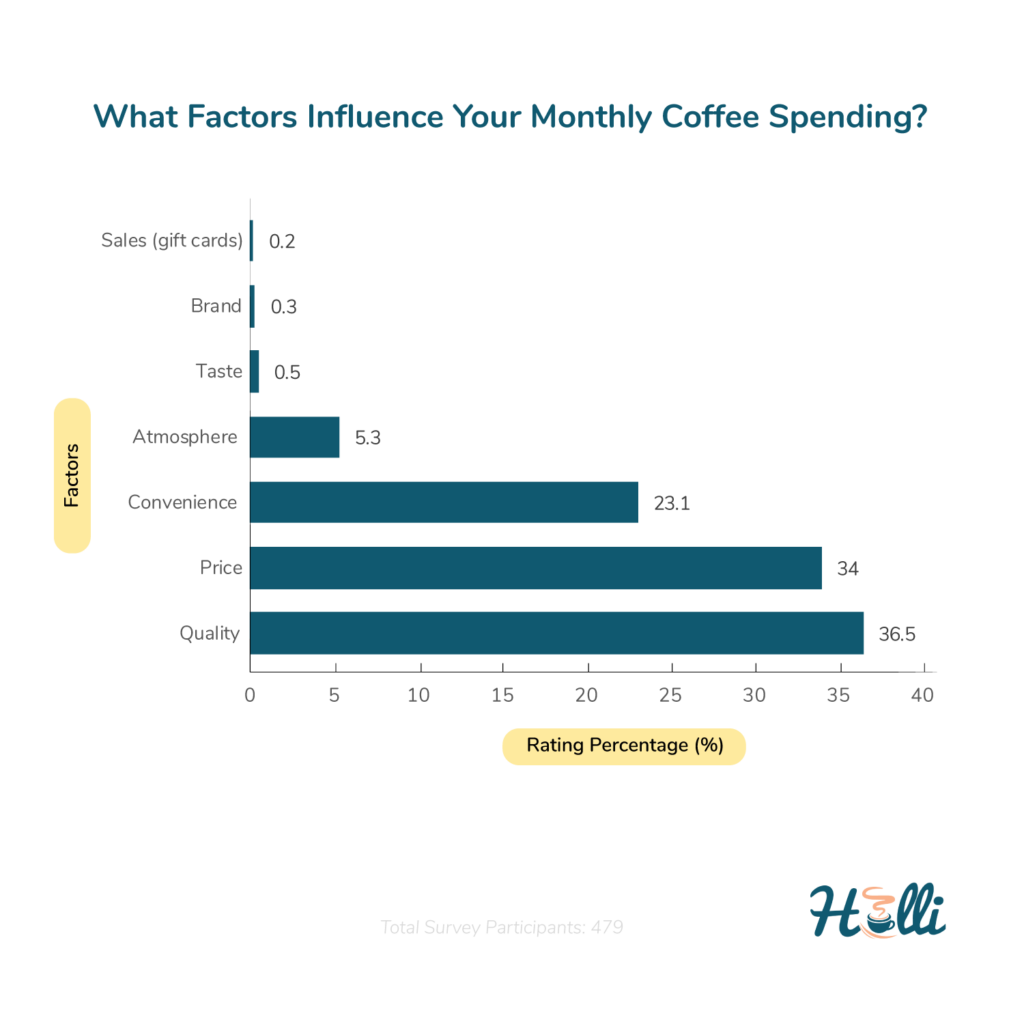
Diving into the coffee purchasing habits of Americans, our research paints a clear picture:
Key Factors Influencing Coffee Purchases in the US:
- Quality: 36.5%
- Price: 34%
- Convenience: 23.1%
Together, these factors account for a significant chunk of purchasing decisions, underscoring the appeal of options like K-cups, pods, and instant coffee. These choices seamlessly blend the allure of quality, cost-effectiveness, and ease of preparation.
On the other end of the spectrum, factors such as:
- Atmosphere: 5.3%
- Taste: 0.5%
- Brand Loyalty: 0.3%
- Sales or Discounts: 0.2%
These appear to exert minimal sway over Americans’ coffee buying decisions. While taste and brand might seem paramount in many product categories, in the realm of coffee, the trio of quality, price, and convenience reigns supreme.
A Deep Dive into Coffee Spending: Demographic Insights
Gender Dynamics
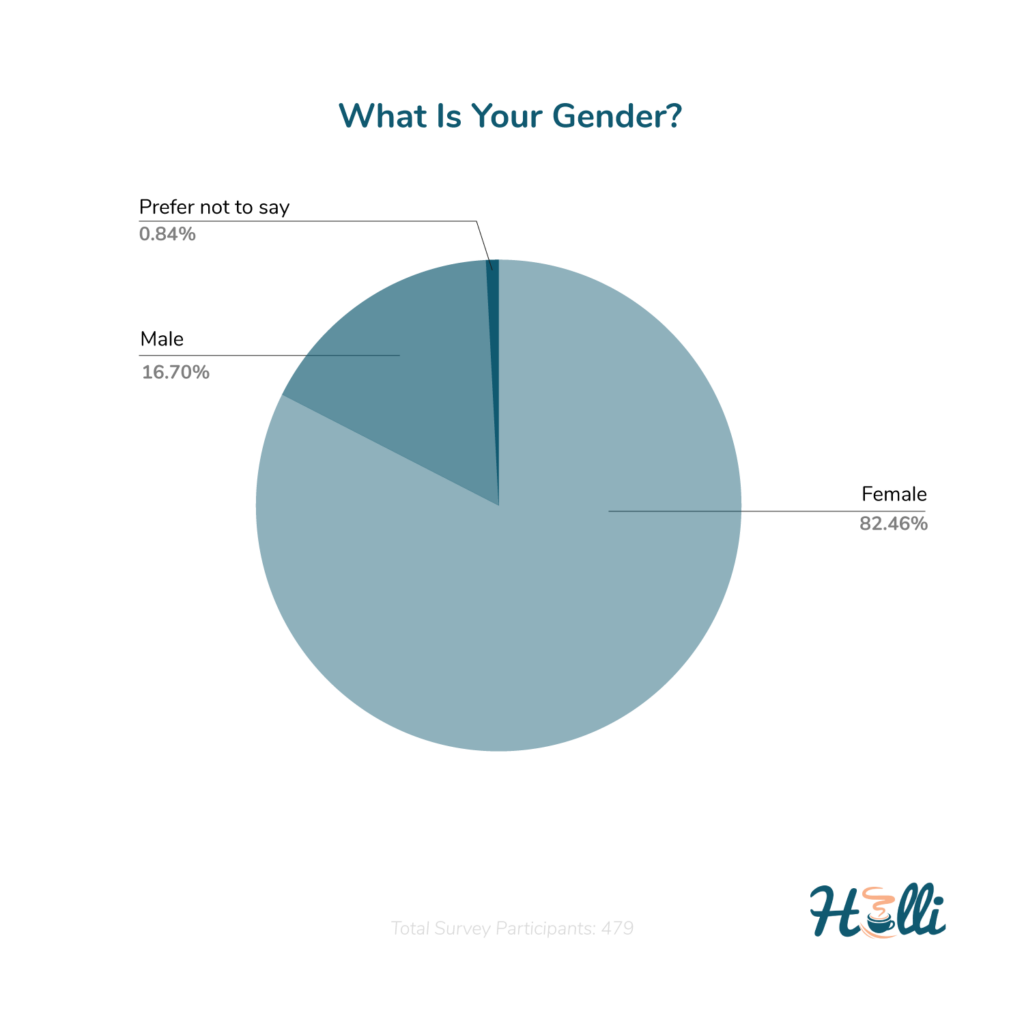
Our survey paints a vivid gender picture when it comes to coffee expenditure:
- Females: 82.5%
- Males: 16.7%
- Preferred not to disclose: 0.8%
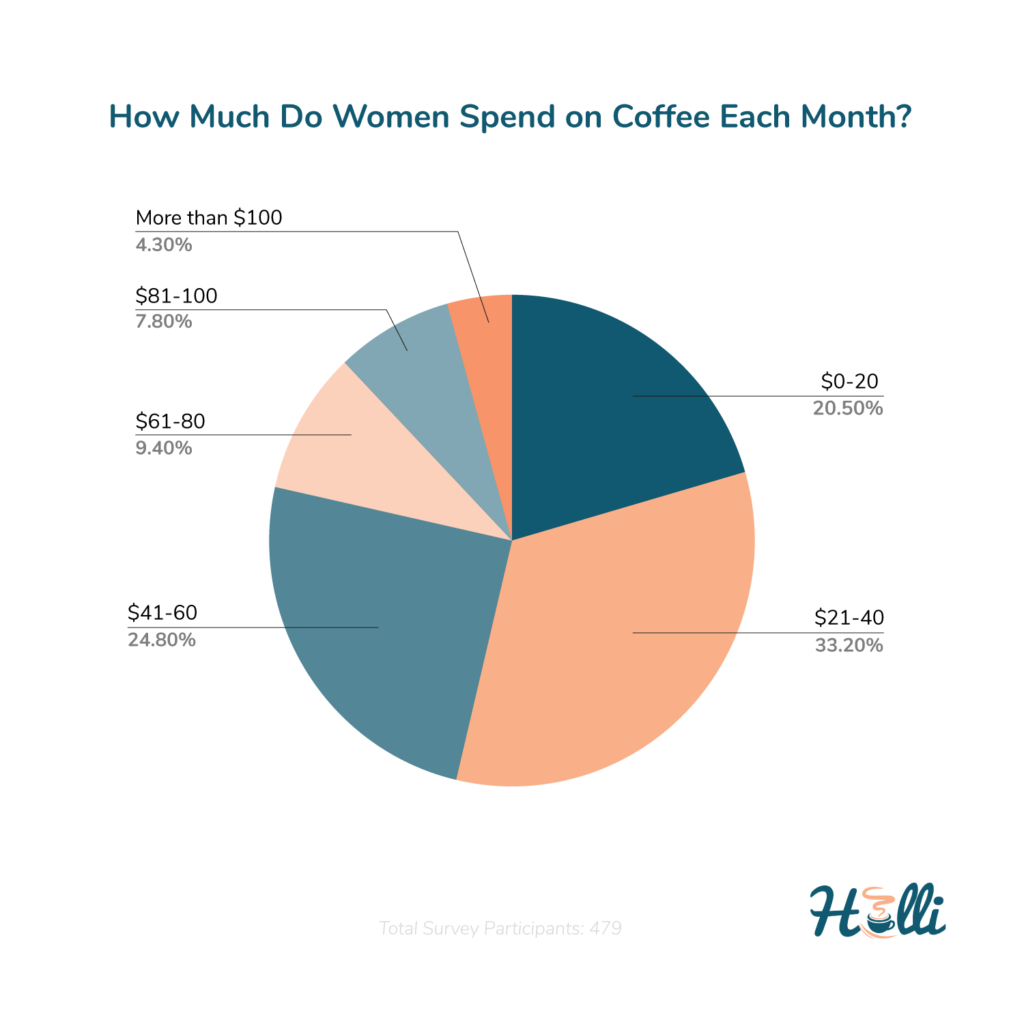
Diving deeper into the expenditure patterns:
- 33.2% of female coffee enthusiasts allocate $21 to $40 monthly.
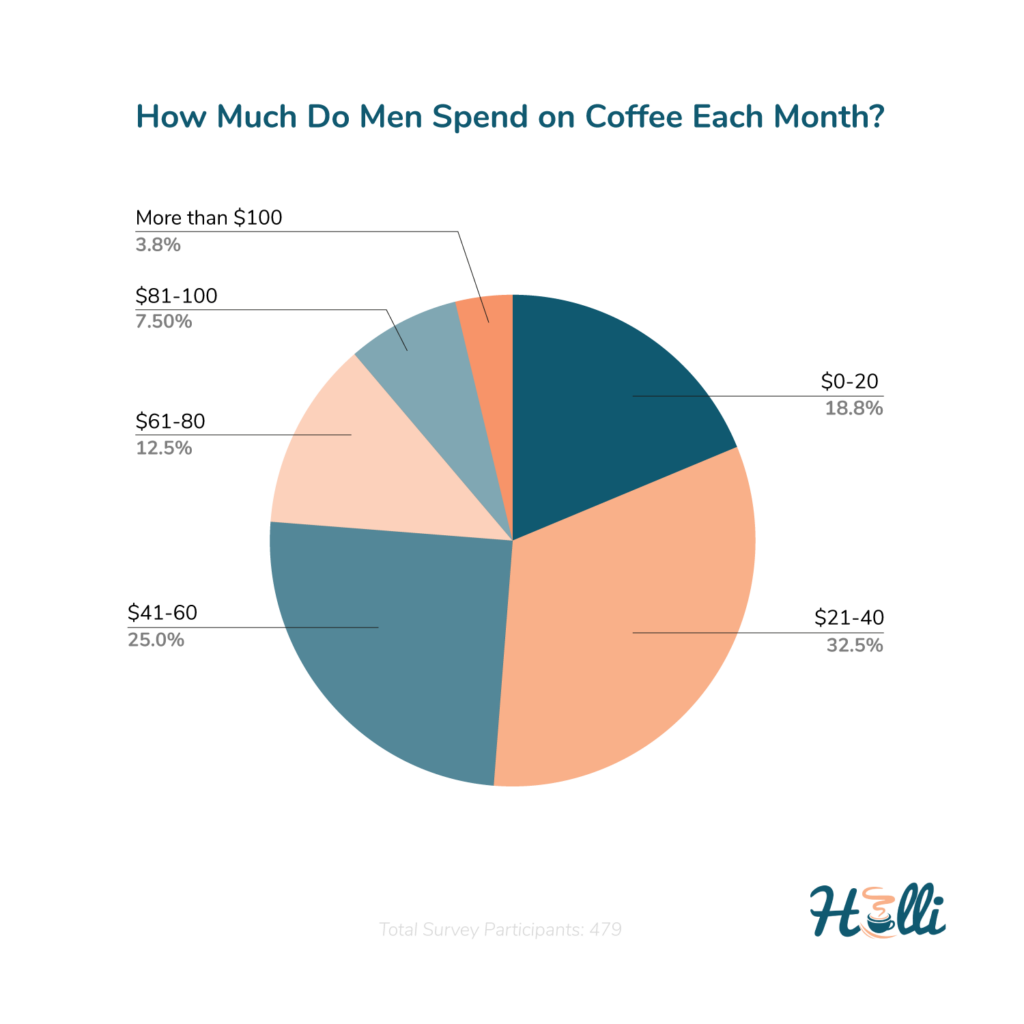
- 24.8% spend between $41 and $60. For males, the spending percentages mirror those of females, with one glaring observation: a significantly higher proportion of women indulge in coffee spending.
Income Patterns
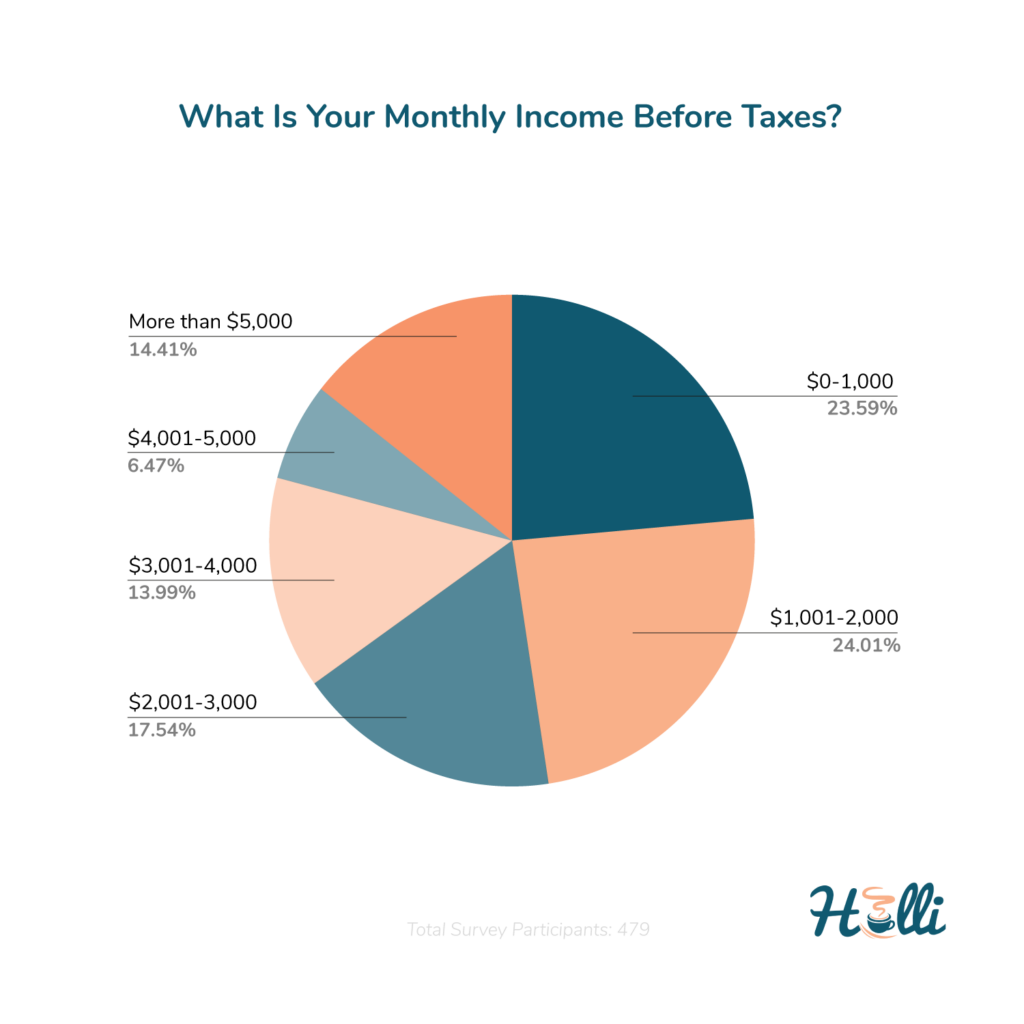
When segmented by income:
- 24% of coffee spenders earn between $1001 to $2000 monthly.
- 23.6% fall within the $0 to $1000 bracket.
- The smallest segment, at 6.5%, earns between $4001 to $5000.
Does income influence coffee expenditure? Surprisingly, across income brackets:
- 32.8% spend $21 to $40.
- 25.3% earmark $41 to $60. One might speculate that coffee expenses would rise with increased income, but our data suggests uniformity across income levels.
Age-Related Trends
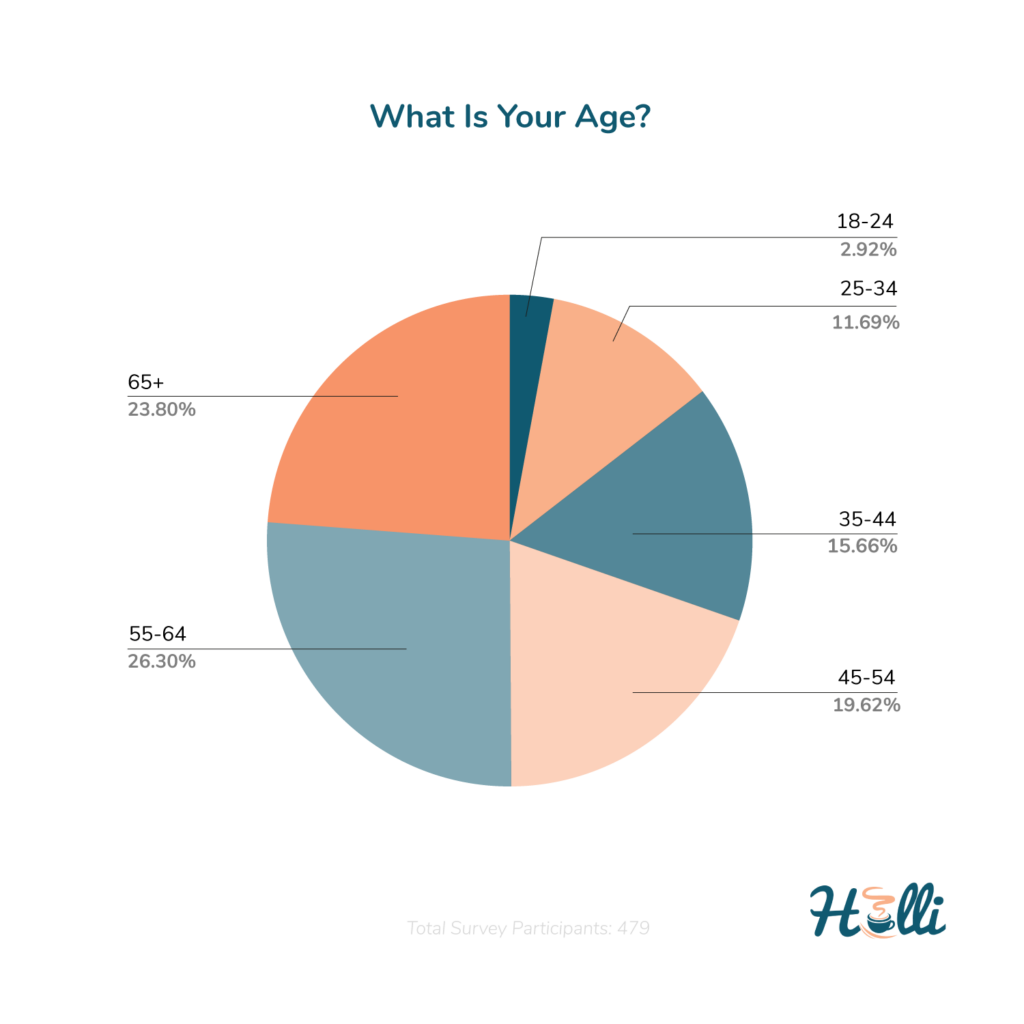
Age-wise, our data reveals:
- 26.3% of coffee purchasers are aged between 55 and 64.
- 23.8% are above 65.
- The younger demographic, 18 to 24 years, accounts for just 2.9%.
Samantha Yu, a seasoned career coach, opines, “The American workforce’s rigor often equates to extended hours and escalated stress, potentially fueling the nation’s coffee fixation. The deeper one dives into the relentless work culture, the heavier they lean on caffeine. Older individuals, it seems, possess more ingrained coffee rituals.”
Reinforcing this is a 2020 Statista survey stating seniors not only drink more coffee than younger groups but consume approximately thrice the daily cups.
Geographical Insights
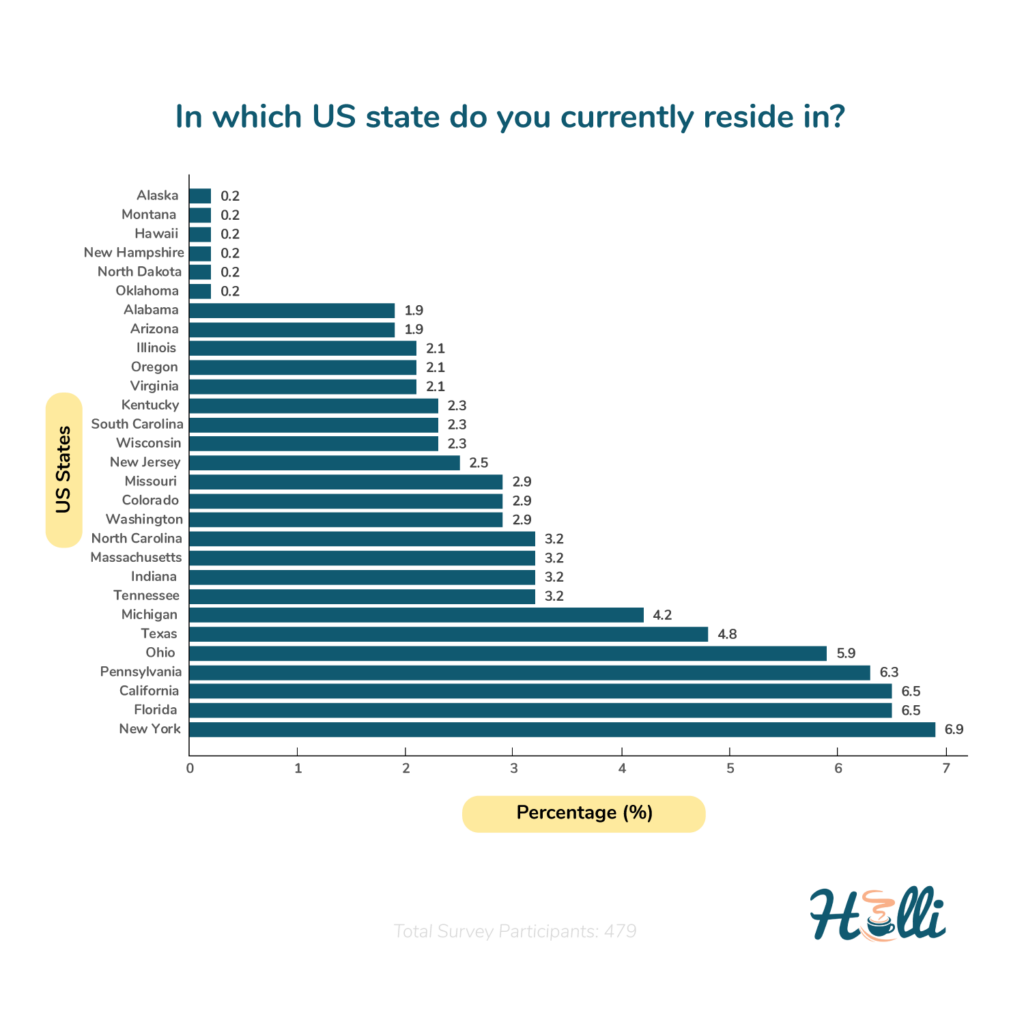
Statewise, New York emerges as the top coffee spender, with 6.9% of its populace investing in coffee monthly. Specifically:
- 27.3% of New Yorkers spend $41 to $60.
Contrastingly, Florida, the next highest at 6.5%, sees 48.4% of its coffee lovers spending $21 to $40.
California (6.5%) and Pennsylvania (6.3%) follow closely. However, states like Oklahoma, North Dakota, New Hampshire, Hawaii, Montana, and Alaska register minimal coffee expenditure at 0.2% each.
Possible reasons could range from state-specific living costs to cultural nuances influencing these spending habits.
U.S. Coffee Consumption Costs: Monthly Statistics and Their Significance
Having scrutinized our research findings, we’ve uncovered significant insights into Americans’ coffee consumption and spending habits.
General Expenditure Trends
A significant portion of Americans earmark a budget of $0 to $60 monthly for their coffee indulgences, with a pronounced preference for K-cups, pods, or instant coffee. For those whose coffee expenditure is on the lower side, their workplaces—often office environments—offering complimentary coffee emerges as a probable reason.
Sarah Morris, an HR Specialist, elaborates, “Companies view free coffee as both a perk and a productivity booster, which inadvertently reduces what employees spend personally on coffee.”
But, individual tastes and workplace cultures can skew this impact.
Influencing Factors
Quality, price, and convenience emerge as the triumvirate shaping American coffee expenditure.
Coffee Historian, Professor Emma Baxter, offers an insightful perspective: “The evolution towards artisanal coffee has reshaped spending behaviors. There’s a discernible trend of Americans gravitating towards specialty, high-quality coffee.” Supporting this, a Specialty Coffee Association (SCA) report, as featured in Forbes, indicates a jump from 9% in 1999 to 41% in 2017 of American adults savoring specialty coffee daily.
Economic Context
Professor Baxter also highlights the elasticity of coffee expenditure, noting that economic downturns might see consumers lean towards more economical coffee choices. In contrast, economic booms can usher in a penchant for premium coffee experiences.
Income Dynamics
Surprisingly, our data shows that varying income levels don’t significantly alter average coffee spending.
Contrarily, economist Jacob Shelton posits, “Coffee, being a luxury item, sees its consumption swell with rising incomes, implying a direct correlation between income growth and coffee expenditure.”
Age and its Influence
Age plays a pivotal role, with a Journal of Nutrition study revealing that 86.4% of Americans aged 60 and above are coffee aficionados.
Professor Baxter believes this can be ascribed to matured palates, entrenched coffee rituals, and a quest for premium coffee experiences, explaining, “Elderly Americans often prioritize quality, impacting their coffee expenditure.”
Forecasting the Future
Interestingly, younger demographics display a modest coffee expenditure. Given their fast-paced lives, there’s a foreseeable shift towards convenient caffeine alternatives, like energy drinks.
Yet, coffee’s appeal seems undiminished, with its expenditure likely to continue its ascent—a testament to the beverage’s entrenched place in American culture.
The Bigger Picture
So, what’s the takeaway for you? Whether you’re an ardent coffee drinker or someone who indulges occasionally, Coffee Holli’s findings offer a treasure trove of insights.
It’s not just about quenching curiosity; it’s about understanding the intricacies of coffee consumption. These insights empower you to make informed choices, akin to picking the perfect coffee beans.
All in All…
Numbers don’t lie.
If you ever doubted coffee’s significance in the lives of Americans, those doubts should now be put to rest. The average American not only loves coffee but is also willing to spend on it.
Our survey didn’t just pose relevant questions to coffee consumers; interpreting its results has brought about significant insights.
A huge thank you to all survey participants. Your input was crucial to our research.
We truly value the perspectives you shared.
So, what’s your take? Do you see any parallels between your coffee habits and the findings?
We’re eager to hear. Drop a comment below!
The Coffee Holli Survey: Participants and Methodology
Survey Objective
Coffee Holli embarked on an insightful survey journey, aiming to decipher the intricate coffee consumption and expenditure patterns spanning various American demographics.
Survey Design
Our meticulously designed questionnaire probed into participants’ monthly coffee outlays, encompassing nuances such as geographic location, preferred coffee variants, and an array of determinants sculpting their spending habits.
Demographics of Our Respondents
Casting a wide net online, we engaged a rich tapestry of coffee aficionados aged 18 and above from the United States. To ensure a comprehensive representation:
- We gathered varied data, including gender, age bracket, monthly earnings, and specific residency details.
- Our outreach was robust, with 479 eager participants from 47 states comprising 365 females, 80 males, and 4 preferring discretion regarding their gender.
- A noteworthy observation spotlighted the age group 55 – 64, boasting 126 participants, while the younger demographic (18 – 24) saw a modest 14 respondents.
- Income-wise, the majority (115 participants) were nestled in the $1001 – $2000 bracket. Interestingly, the $4001 – $5000 bracket saw a relatively reserved participation with 31 respondents.
| What is your age? | Responses |
|---|---|
| 18 – 24 | 14 |
| 25 – 34 | 56 |
| 35 – 44 | 75 |
| 45 – 54 | 94 |
| 55 – 64 | 126 |
| 65+ | 114 |
| Overall | 479 |
| What is your monthly income before taxes? | Responses |
|---|---|
| $0 – 1,000 | 113 |
| $1,001 – 2,000 | 115 |
| $2,001 – 3,000 | 84 |
| $3,001 – 4,000 | 67 |
| $4,001 – 5,000 | 31 |
| More than $5,000 | 69 |
| Overall | 479 |
Data Collection and Analysis
We employed a trusted online platform for seamless data collection and amplified our reach through strategic social media promotions. Once collated, the data was meticulously analyzed using sophisticated statistical tools. This rigorous process unveiled intriguing facets of American coffee habits, focusing on determinants such as:
- Pricing dynamics
- The allure of convenience
- The quest for quality
- Ambiance preferences, among others.